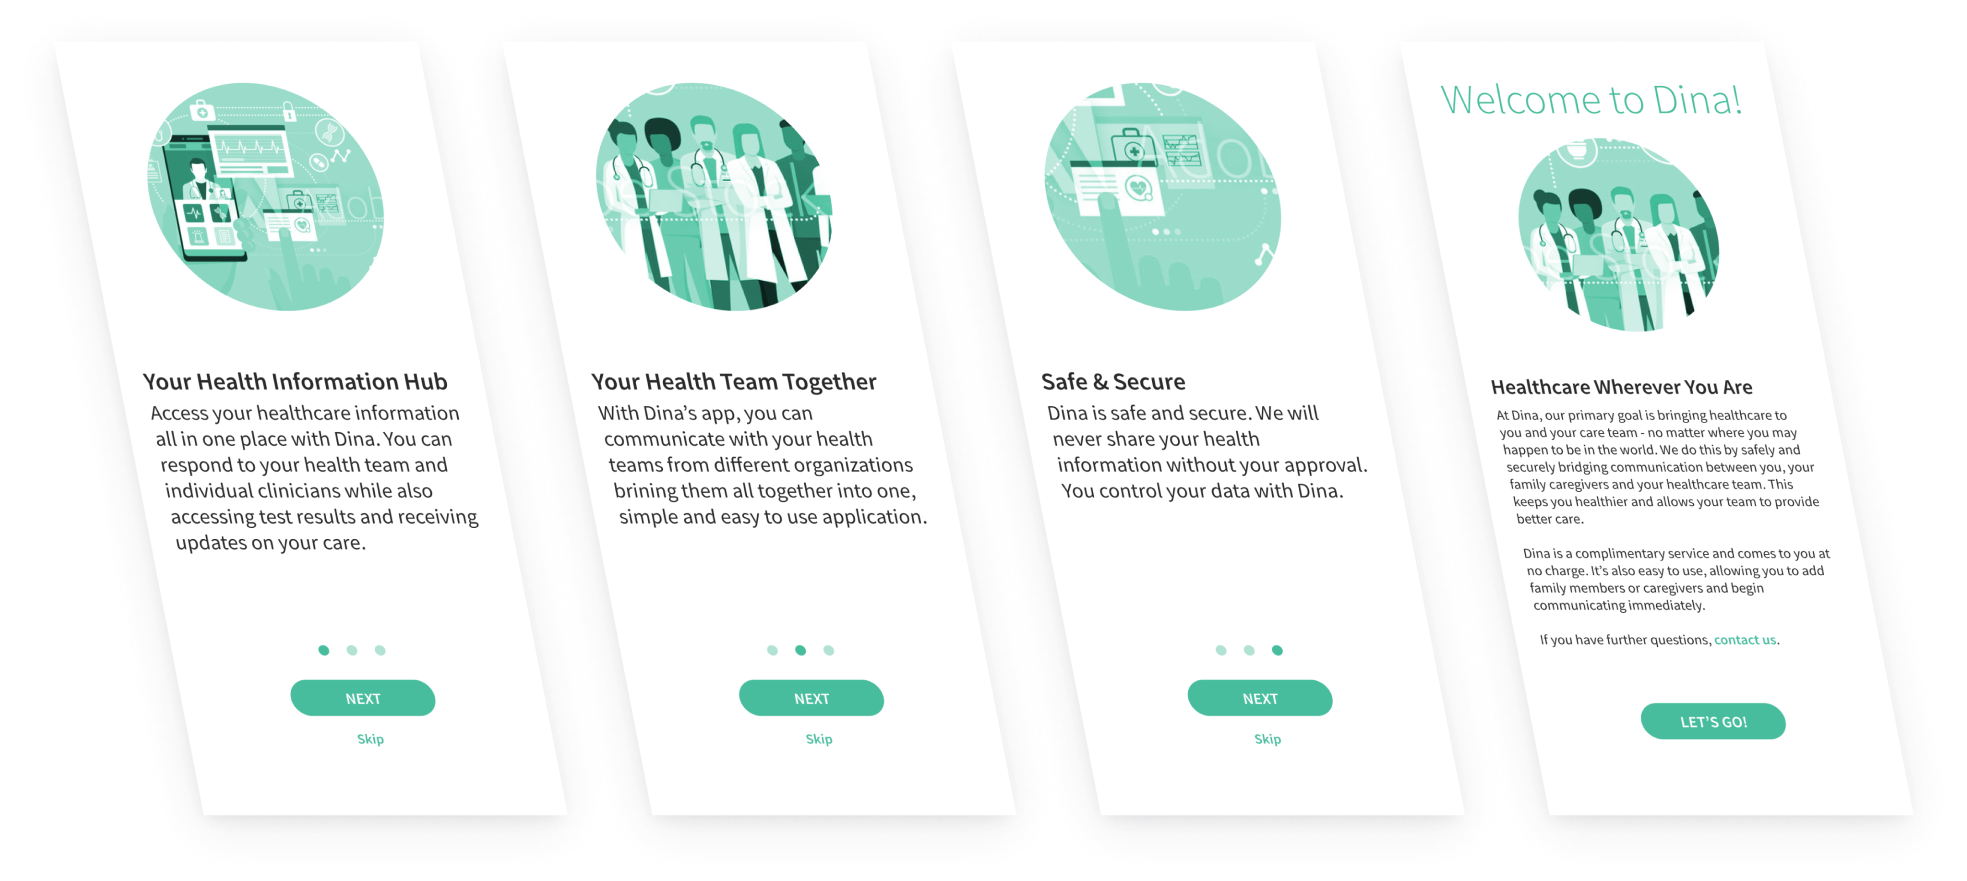
Dina
Home Health | Telehealth | UX / UI | UX Research | Mobile | Design Systems

Overview
Closing the Gaps in Care Coordination
Dina is a home healthcare company with a mission to keep patients in the home longer, resulting in reduced costs and higher patient satisfaction. The position itself was one in which I was solely responsible for the user experience in a startup environment encompassing projects ranging from analytics and data visualization to rebranding our product suite, building a design system and expanding our product feature set to enhance the user experience. This effort involved educating executives and colleagues to increase the level of design maturity within the organization and position the company for future growth.
This was a position in which I wore multiple hats, working through federal regulations one day, interviewing clients the next and reading through OASIS and MDS-HC data sets another day. There was a little of everything in this position with never-ending responsibilities. I managed our rebranding effort for the front-end facing aspect of our product and all new feature sets, to include a brand new product for remotely monitoring patients.
The position also involved managing all UX research efforts, which included interviews, usability testing, qualitative data analysis and the organization of our body of client research. Additionally, I routinely presented results (in presentation format) to the organization to develop a sense of shared understanding of our end-users.
My primary work at Dina involved working through the issues involved in transitioning a patient from one institution to another or from an institution to their home. For patients at home, I worked through design features to increase the safety of patients, establish communication between disparate care teams and provide the means to monitor patients beyond the healthcare facility.
Role
Principal User Experience Designer
Primary Responsibilities
Managing all aspects of design and visual assets for the organization
Planning, designing and assisting in the implementation of new features to the platform
Establishing styles, enforcing branding guidelines and development of a working design system
All aspects of UX research to include formative and summative research as well as the presentation of results
Interpreting and understanding federal regulations affecting our product and client workflows
Educating the organization to increase the level of design maturity
Data Visualization
Requirements gathering and writing
Organization Size
20 – 25
UX Team Size
1
Projects
Referrals & Transitions of Care
Patients don’t always return home when they are discharged from a medical facility. They often transition from one facility to another for further recovery or longer term treatment. This is called a transition of care and it is a complicated endeavor involving a back-and-forth between the discharging and admitting facilities and a massive amount of paperwork. This paperwork is generally referred to as a discharge summary – a summary of care received, diagnosis, outcomes, test results, etc. Even more complicated is the referral process, which involves sending the discharge summary and a request to each institution a patient may be a fit for. This transition process was a primary function of Dina’s platform and a focal point in my work.
Dina had a software platform that allowed transitioning a patient from one facility to another. But the process was complicated and the digital workflow didn’t match the needs of the end-user workflow. I conducted research using interviews and journey maps to piece together the end-user referral flow and develop a matching digital workflow. Using a shopping cart analogy, I redesigned the initial feature to allow multiple providers to be added to a single patient referral and sent in unison. This sped up the referral process significantly while also transitioning patients more efficiently and increasing bed utilization rates.
As a final note, I worked through a number of projects designed to address federal guidelines concerning the referral process. Federal regulations had been implemented to regulate patient choice in the referral process. This regulatory requirement was intended to reduce provider bias when transitioning patients. My work in this respect, addressed the patient experience and stipulated new flows and features to enable patients greater engagement in their own care.
Remote Patient Management
Skilled nursing facility (SNF) costs can range anywhere from $6,000 – $10,000 per month. Couple the costs with current Medicare standards, which will only provide coverage for the first 100 days and it becomes highly advantageous to monitor, manage and treat patients at home. This was a large part of the work Dina conducted and a number of projects I designed for were related to remote patient management.
Remote Patient Management (RPM) involves risk identification and mitigation. I worked through several projects with Bayada Home Health to identify patients who might be at risk for readmission. Early identification involved data integration with tools such as the DIVERT model used to detect early warning signs for ER admission. Additionally, I worked with a data scientist to integrate MDS-HC and OASIS data into our platform, which provided us with the means to evaluate social determinants of health (SDoH).
RPM was also used as a screening tool where I designed a solution for COVID-19 screening as well as screening and monitoring patients with chronic medical conditions such as congestive heart failure (CHF) and chronic obstructive pulmonary disease (COPD). In each of these projects, I conducted UX research (semi-structured interviews, qualitative data analysis, journey maps and task analysis) to develop design solutions.
Social Determinants of Health
Social determinants of health (SDoH) relate to economic and social factors that influence or shape a patient’s health status. Examples include, but are not limited to, economic status, education, access to healthcare or food and transportation availability. These risk factors can be used to determine an individual’s quality of life and likelihood of poor health outcomes related to their disease.
Working with a data scientist, I evaluated both MDS-HC and OASIS data to develop an algorithm and design a scorecard for patients. This scorecard allowed healthcare providers to quickly evaluate a patient’s risk beyond behavioral or individual risks, providing another point of data to determine a patient’s health status while also remotely monitoring them. The benefit of the scorecard was to quickly summarize the data obtained through home health visits where OASIS or MDS-HC forms would be completed.
The outcome of this project was a marked increase in the efficiency of healthcare providers when evaluating patient risks. Instead of combing through government forms and attempting to make sense of the data, they could quickly view a current and/or previous scorecard for early identification of patient risks they may need to address.
Network & Provider Directory
Part of transitioning a patient to another care facility (the referral process – see above) or discharging patient is identifying facilities they have beds available, are willing to take a patient with their condition and are within an acceptable geographic location for the patient and their loved ones. This includes DME (durable medical equipment) facilities that may or may not have the medical equipment on hand or be conveniently locate for pickup or ship the equipment if available.
Dina had built a network of these organizations and facilities. However, there were problems with the interface and search functionality. This was a project I was especially equipped to manage, given my experience with SEO, information architecture and search.
Querying a UX research database I had developed and working with product managers I assisted in both developing and writing requirements while iteratively working through design revisions for our network and provider directory products. This included designing new search pathways and functionality, geospatial search parameters for DME providers, implementing HCPCS codes and entirely new features and flows for end-users to manage their organizational profiles.
The outcome of this project was a more finely tuned search for end-users and granular management of profiles for those with organizational admin access. Ultimately, this enabled targeted referrals and a faster process for transitioning patients.
Reporting & Analytics
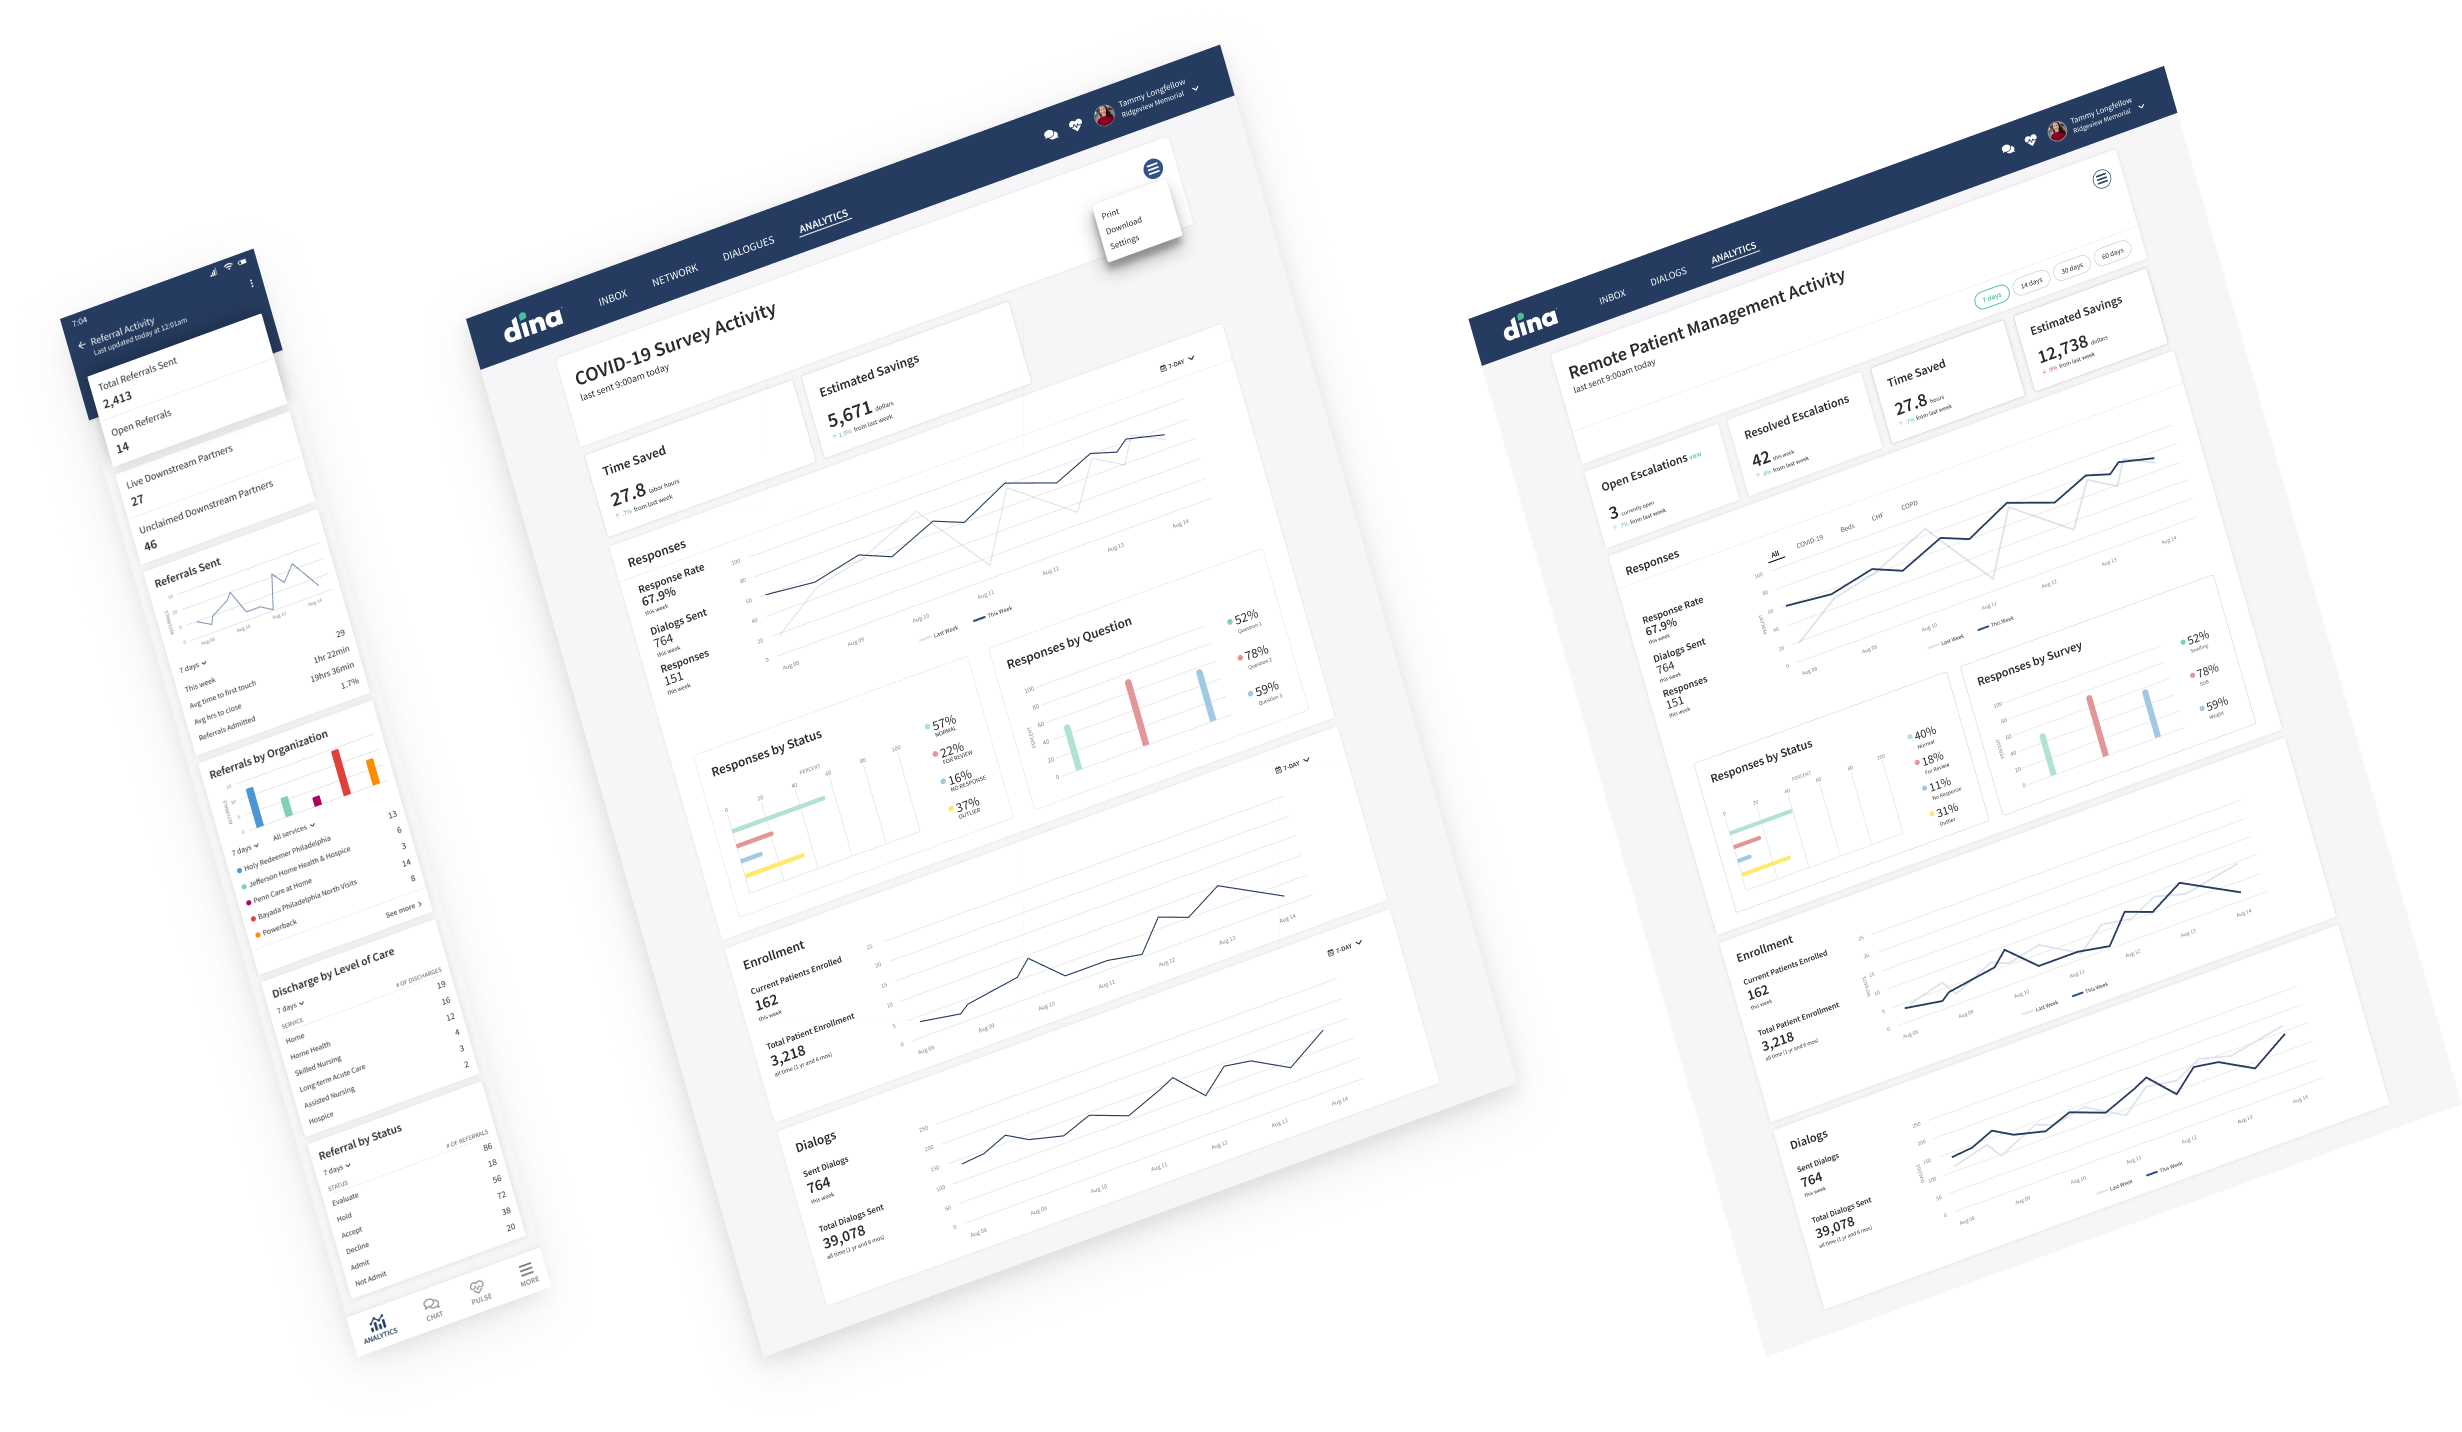
Across Dina’s product line, there was a rich set of analytics available for the end-user. How many referrals had been sent in the past month? How many screenings were patients answering or not answering? What population health data? How many readmissions had a given organization experienced in the past week or month?
Until I arrived, this data had been largely internal and only available to our clients via weekly or monthly reports. The data was housed in Looker, which allowed for queries and PDF reports. Each week or month, we would send reports to the organizations requesting them. This was a burden for the customer success team.
Using the existing Looker reports, I spearheaded a project to make the data available in near-realtime to our end-users via analytics dashboards. These dashboards were a welcome addition to our product line and clients gravitated to them. They were especially helpful in determining not only the success of any given campaign, but they also provided a clear business case for the purchase and continued use of our product.

Qualitative Data Analysis
Dina had been collecting end-user feedback for a number of years using ProductBoard. There were literally hundreds of individual requests and items in ProductBoard stipulating end-user needs, ideas and requests. Using AirTable and my experience with qualitative data, I developed a code book to begin organizing all of the feedback. This enabled us to query the database and develop statistics for our individual products.
This was a 6-month process for me where I worked through each item of feedback, line-by-line, to organize it all into a meaningful dataset. Ultimately, this fed into our decision-making process and impacted our road maps.
