Baxter
Medical Devices | Telehealth | EHR / EMR | UX / UI | UX Research

Overview
Peritoneal Dialysis Remote Patient Care & Monitoring
Dialysis is a life-changing event for all patients. Not only are there the obvious health concerns ever-present on a patient’s mind. But there is also the inconvenience of actually receiving the treatment. In-clinic dialysis requires scheduling what can be multiple weekly sessions. It is, to say the least, a cramp in most patients’ lifestyles.
Baxter had developed the technology to conduct dialysis at home for some patients. Peritoneal dialysis can be completed in the comfort of a patient’s home and conducted overnight as they sleep. The machine used for this can record data and report this data back to a system called Sharesource.
Sharesource had the ability to report detailed medical information to a clinician. This would enable clinicians to make important decisions regarding the patient’s treatment program. It also served as a latent clinical decision support system with alarm activity reporting and alerts for healthcare staff.
I led the design of a the next version of Sharesource on an 8-month contract with Baxter. Bearing aspects of telemedicine, data visualization and clinical decision support, this project directly impacted patients’ lives, care and well-being.
Role
User Experience Designer
Primary Responsibilities
Manage all aspects of UX design and visual assets for the project
Coordinate hand-off with developers, consulting with them on difficult front-end issues
Establish data visualization standards to quickly communicate status of patients receiving remote care
Establish styles and maintain consistency as well as brand awareness
Understand and speak to the technical aspects of peritoneal dialysis for the purposes of writing and developing front-end requirements
Organization Size
60,000+
UX Team Size
1
Projects
Patient Analytics
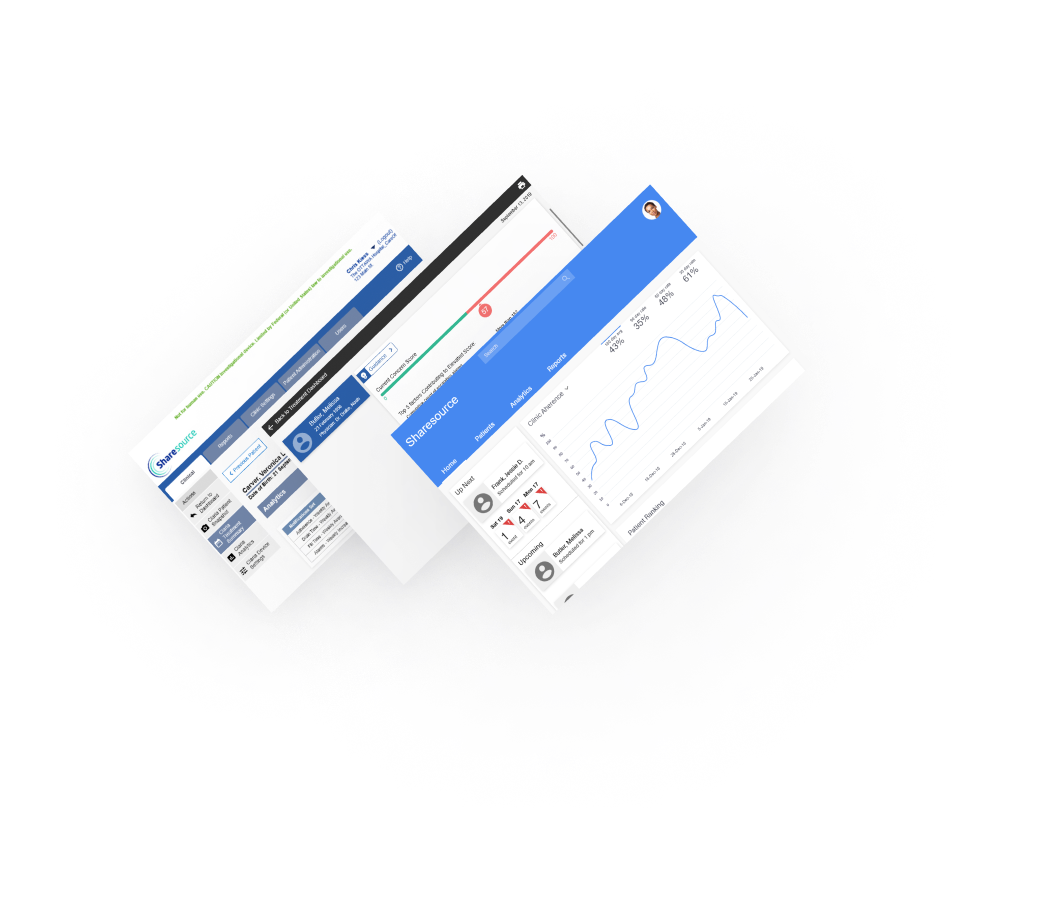
Sharesource was in its first version when I arrived. The greatest need for the product was to provide a quick overview of the patient’s treatment and dialysis history. This involved understanding the patient’s adherence to treatment at home and in the clinic (treatment time), the health of their catheter (drain time and fill time), how long the solution had been in their body (dwell time) and the types of alarms they had received during treatment. Displaying all of this information required a dashboard. But the dashboard was in the form of tables in the first version.
Tables are a great way of analyzing data at a granular level. But they are not the best choice for overworked clinicians needing a quick overview of where a patient might be experiencing difficulties. This would require data visualization.
I worked with the product management team, the human factors team and engineering to determine what was possible, what was needed and what federal regulations would require in a tool bordering on clinical decision support while supporting a medical device. I also spent a considerable amount of time reading through previous research and worked with human factors on usability testing. This enabled me to build a dashboard that would visualize the patient’s treatment data longitudinally and was a major step forward for the product.
Patient Reporting
In addition to the patient’s treatment dashboard, we also needed a way to manage those patients experiencing a multitude of issues in treatment. Also, we wanted the ability to add a score that would indicate the level of concern regarding the patient’s treatment and compare those scores across a historical picture of their data.
For this aspect of the project, I developed a reporting structure and screen that would visualize a patient’s score and the top issues they were experiencing related to their current score. Additionally, this report would also offer guidance based on Baxter’s guidelines for treatment with their device. This would enable clinicians to quickly understand a patient’s trends regarding treatment.
A great benefit to the reporting feature was the ability to have a summary of the patient’s treatment at all levels that was only a click away. Instead of rustling through papers and reports, clinicians had the ability to review a patient quickly prior to seeing them and understand where the patient stood in relation to treatment.
In both of these projects, I was able to visualize top-level data in a summary format, allowing clinicians to become more efficient during their appointments as well as highlight issues of concern that could be proactively managed. For example, a slow drain time could indicate an issue with the patient’s catheter. The device could also track issues such as blood pressure values, if alarms were decreasing or increasing and modifiable risk factors related to the patient demographics.
